
Reorder Point Formula: How to Calculate When to Reorder
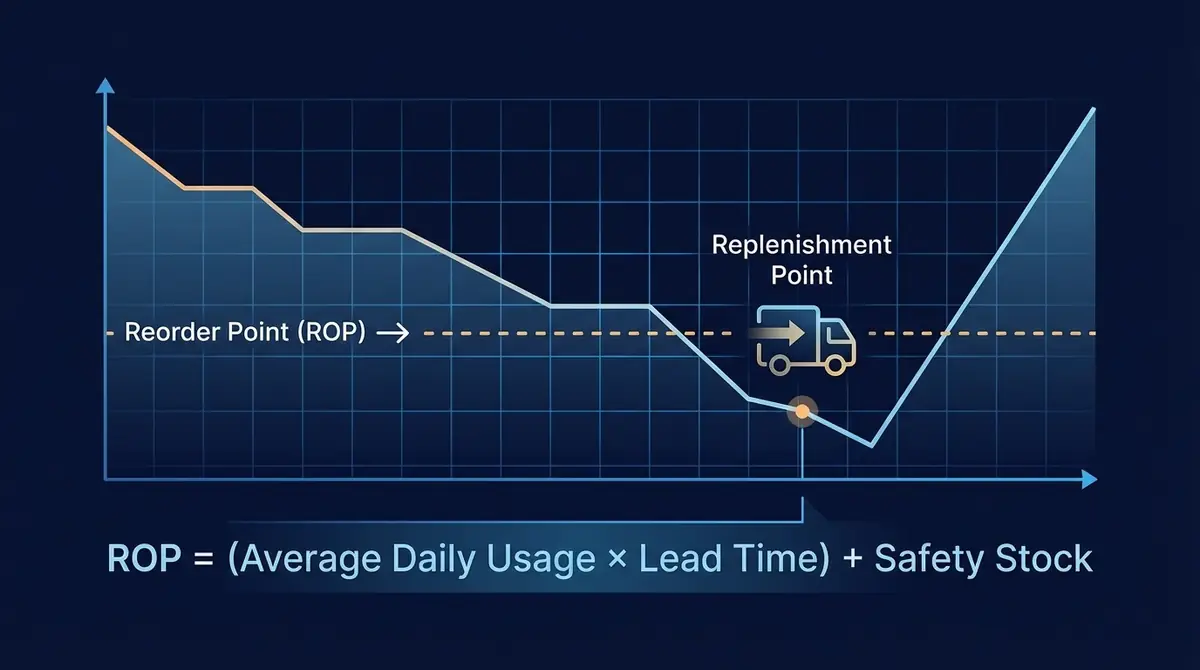
A reorder point is the stock level at which you place the next purchase order, so new units arrive before you run out. This guide covers the formula, how to estimate each input, a worked example with hypothetical numbers, and how to turn reorder points into low-stock alerts.
What a reorder point is
A reorder point (ROP) is a stock quantity that triggers a purchase order. When a product's inventory position (defined below) falls to that number, you reorder. The number is set so the stock you still hold covers the sales that happen while you wait for delivery, plus a buffer in case sales run faster or the supplier runs later than expected.
Without a defined reorder point, reordering depends on someone noticing that a product looks low. That works for a handful of products and breaks down as the catalog grows. A reorder point per product, calculated from your own numbers, replaces that judgment call with a rule you can check.
The reorder point formula
All three inputs must use the same unit of time. If demand is measured per day, lead time is in days. If you prefer weekly numbers, use units per week and lead time in weeks. The result is a quantity in units, not dollars.
The first term is the stock you expect to sell while the order is on its way. The second term, safety stock, covers the uncertainty around that expectation.
The three inputs
Average daily demand
Pick a window long enough to smooth out noise but short enough to reflect current demand. Some things to watch when you pull the numbers:
- Use units, not revenue. Say a $50 item sells 10 a day and a $5 item sells 100 a day (hypothetical numbers). Both bring in $500 a day but need very different amounts of stock.
- Leave out days the product was unavailable. A zero on a day you had no stock is not zero demand. Counting it pulls the average down and makes the next stockout more likely.
- Treat promotions separately. A sale week can inflate the average. Decide whether you expect promotions to repeat, and plan for them on purpose instead of letting them distort the baseline.
- Split seasonal products. If demand differs a lot between peak and off-peak, calculate a separate rate for each. See seasonal inventory planning.
If you track sales velocity week to week, a moving average of recent weeks is a simple way to keep this input current. See sales velocity tracking for more on that.
Lead time
Lead time is the number of days between placing the order and having the units available to sell. It includes:
- Supplier processing or production time
- Transit time to your warehouse or fulfillment partner
- Receiving, counting, and putting stock away
Use the lead times you have actually experienced, not the supplier's quote. Record the order date and the date stock became available for every purchase order, and keep a separate figure per supplier. The average gives you the number for the formula. The spread around that average tells you how much safety stock you need.
Safety stock
Safety stock is extra inventory held to absorb surprises. There are several ways to size it. Three common ones are below, and the safety stock formula guide covers them in detail.
- Max minus average. Safety stock = (Maximum daily demand × Maximum lead time) − (Average daily demand × Average lead time). It is easy to compute but assumes the worst demand and the worst delay both happen together.
- Service-level method. Safety stock = Z × σD × √L, where Z comes from your target service level, σD is the standard deviation of daily demand, and L is lead time in days. It uses the actual variation in daily demand and treats lead time as fixed.
- Combined variability. Safety stock = Z × √(L × σD² + D² × σL²), where D is average daily demand, σL is the standard deviation of lead time in days, and ² means squared. Use it when both demand and lead time vary.
Common Z values are 1.28 for a 90% service level, 1.65 for 95%, 1.96 for 97.5%, and 2.33 for 99%. A service level here means the probability of getting through one replenishment cycle without a stockout. Higher targets need more buffer, and the cost grows quickly as you approach 100%.
Worked example
These numbers are hypothetical. Say you sold 270 units of a product over the last 90 days, and it was in stock every day.
- Average daily demand: 270 ÷ 90 = 3 units per day
- Lead time: 3 days supplier processing + 7 days transit + 1 day receiving = 11 days
- Demand during lead time: 3 × 11 = 33 units
- Safety stock: you aim for a 95% service level (Z = 1.65), and daily demand has a standard deviation of 2 units. Safety stock = 1.65 × 2 × √11 = 1.65 × 2 × 3.317 = 10.9, which rounds up to 11 units
Reorder point = 33 + 11 = 44 units. When your inventory position falls to 44, place the order.
For comparison, the max-minus-average method with a peak of 7 units per day and a longest lead time of 14 days gives safety stock of (7 × 14) − (3 × 11) = 98 − 33 = 65 units, and a reorder point of 33 + 65 = 98. The gap between 44 and 98 shows how much the choice of method matters. The simple method assumes the peak demand and the longest delay happen together, and it builds in the 14-day worst-case lead time. The service-level calculation above treats lead time as fixed at 11 days, so it holds less stock. To include lead-time variability in the statistical approach, see the combined formula in the safety stock guide.
Compare against inventory position, not just on-hand
The reorder point should be checked against your inventory position: units on hand, plus units already on order, minus units committed to open orders. If you compare on-hand stock only, a purchase order that is already on its way will not count, and you may place a duplicate order or reorder too early.
Also think about how often you check. If you review stock once a week, a product can cross its reorder point just after a review and sit below it for several days. In the worst case your effective lead time is the supplier lead time plus the number of days between checks, so either check more often or raise the reorder point to match.
Adjusting for seasonality, promotions, and suppliers
- Seasonality. Recalculate with the demand rate you expect in the upcoming period, not the trailing average. A reorder point built from off-peak sales will be too low as demand climbs.
- Promotions. If you plan a sale or a feature, estimate the lift from past similar events and raise the reorder point ahead of time, allowing for the lead time.
- Multiple suppliers. If the same product can come from two suppliers with different lead times, each has its own reorder point.
- Minimum order quantities. If the supplier's minimum order is larger than what the formula implies you need, you will hold more stock than planned. The economic order quantity formula addresses how much to order. The reorder point only addresses when.
Turning reorder points into alerts
A reorder point only helps if someone acts on it. A practical alert setup includes four kinds of signal:
- Low-stock threshold. A fixed, rough number that warns you a product is getting thin. Useful as an early heads-up, but it ignores sales speed and lead time.
- Reorder-point alert. Fires when a product's inventory position reaches the calculated reorder point. This is the one that should lead to a purchase order.
- Out-of-stock alert. Fires at zero available. The response is practical: pause advertising for that product, expedite any open purchase order, and decide whether to take back-in-stock requests.
- Demand-spike check. A comparison of the last few days of sales against the recent average. A large jump is a signal to recalculate that product's reorder point right away.
Be careful where you set the trigger. Suppose a product sells 20 units a day, lead time is 14 days, and you want 100 units of safety stock. The reorder point is (20 × 14) + 100 = 380 units. An alert set at the safety stock level of 100 would fire after you have already sold through the stock meant to cover the wait. At 20 units a day, the remaining 100 units last 5 days, and the shipment would arrive 9 days after you ran out.
If you can export inventory and orders from your store admin to a spreadsheet, that is enough to maintain a sheet with one row per SKU holding its reorder point, units on hand, and units on order. Flag any row where on hand plus on order, minus units committed to open orders, is at or below the reorder point.
Keeping alerts useful
- Prioritize. Not every SKU needs the same attention. ABC analysis helps you decide which products get daily review and which get a weekly look.
- Name an owner. Each alert should go to the person who can place the order. If it sits unanswered for an agreed time, say a business day for your top sellers, it should go to someone else.
- Review monthly. Look at any stockout that happened without a warning, which suggests a threshold that was too low. Look also at alerts that fired long before you needed stock, which suggests one that was too high.
- Track the outcomes. Useful measures include the number of stockouts per month, the days between an alert and a purchase order, and the share of alerts that led to an order. See the inventory KPI guide.
Common mistakes
- Using the supplier's quoted lead time instead of the one you actually experience.
- One safety stock rule for every product. A flat "two weeks of cover" overstocks slow sellers and under-protects fast ones.
- Counting stockout days as zero demand, which understates the demand rate.
- Comparing on-hand stock only, ignoring units already on order.
- Setting the numbers once and never revisiting them. Recalculate on a schedule, and again whenever demand or a supplier's lead time changes noticeably.
- Mixing units. Weekly demand with a lead time in days gives a reorder point that is off by a factor of seven.
Where to go next
The reorder point tells you when to order. The related questions are how much to order, covered in the economic order quantity guide, and how much buffer to hold, covered in the safety stock guide. To reduce the chance of an empty shelf more broadly, see preventing stockouts. For the purchasing side of the process, see purchase order management.