Stockouts are the silent profit killers of e-commerce. Every time a customer encounters an "out of stock" message, you don't just lose that sale—you risk losing that customer forever. Research by IHL Group reveals that stockouts cost retailers globally $1.77 trillion annually, with the ripple effects extending far beyond immediate lost revenue.
But stockouts aren't inevitable. With the right strategies, frameworks, and tools, you can virtually eliminate stock shortages while maintaining efficient inventory levels. This comprehensive playbook provides actionable strategies that Shopify merchants can implement immediately to prevent stockouts and protect both revenue and customer relationships.
Understanding the True Cost of Stockouts
Before diving into prevention strategies, it's crucial to understand what's at stake when products go out of stock.
Immediate Revenue Loss
The most obvious impact is the lost sale. If a customer wants to buy your product but it's unavailable, that's immediate revenue walking out the door. For high-margin products or during peak selling seasons, a single stockout incident can cost thousands of dollars.
Customer Defection
Research by the Harvard Business Review found that 43% of customers will go to a competitor if their desired product is out of stock, and 30% of those customers won't return even when the item is back in stock. The customer acquisition cost you invested in bringing them to your store? Gone.
Brand Reputation Damage
Stockouts signal unreliability. In an era where Amazon has trained consumers to expect immediate availability, frequent stockouts damage your brand's credibility. Customers begin to view your store as unreliable, which affects future purchasing decisions even when items are in stock.
Lost Cross-Sell and Upsell Opportunities
When customers can't buy their primary intended purchase, you lose not just that sale but all the additional items they might have added to their cart. The average order value impact extends beyond the stocked-out item itself.
The $100,000 Stockout: A Real Example
A mid-sized Shopify electronics retailer experienced a stockout on one of their bestselling products during Black Friday weekend. The immediate impact:
- Direct lost sales: $28,000 over 4 days
- Lost cross-sells: Estimated $12,000 based on average basket size
- Customer defection: 340 customers went to competitors, with a lifetime value of approximately $180 each = $61,200
- Total cost of single stockout event: $101,200
The product represented less than 8% of their SKU count but this single incident cost more than their entire annual inventory management software budget.
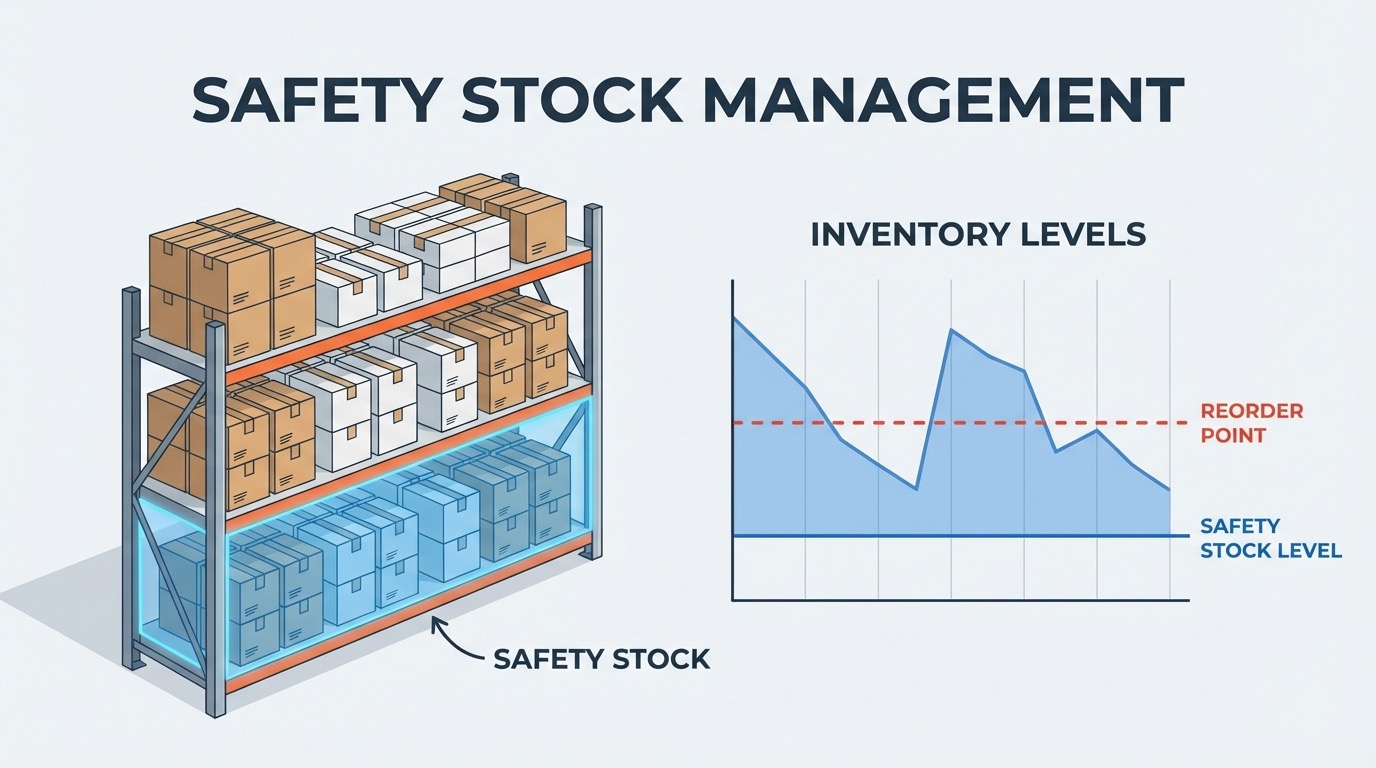
Strategy 1: Master Safety Stock Calculations
Safety stock—the buffer inventory you maintain above expected demand—is your first line of defense against stockouts. However, many retailers either don't calculate safety stock properly or use overly simplistic formulas.
The Basic Safety Stock Formula
The standard safety stock formula is:
Safety Stock = (Maximum Daily Sales × Maximum Lead Time) - (Average Daily Sales × Average Lead Time)
While this formula works for simple scenarios, it has limitations. It doesn't account for demand variability or provide confidence levels.
The Advanced Safety Stock Formula
For more sophisticated safety stock management, use the statistical approach:
Safety Stock = Z-Score × √(Average Lead Time × Variance of Demand + Average Demand² × Variance of Lead Time)
Where:
- Z-Score represents your desired service level (e.g., 1.65 for 95% service level, 2.33 for 99%)
- Variance of Demand is the standard deviation of your daily sales squared
- Variance of Lead Time is the standard deviation of supplier lead times squared
Practical Application: Calculating Safety Stock
Let's walk through a real example:
Product: Premium Wireless Headphones
Average daily sales: 12 units
Standard deviation of daily sales: 4 units
Average supplier lead time: 14 days
Standard deviation of lead time: 3 days
Desired service level: 95% (Z-score = 1.65)
Applying the formula:
Safety Stock = 1.65 × √(14 × 16 + 144 × 9)
= 1.65 × √(224 + 1,296)
= 1.65 × √1,520
= 1.65 × 38.99
= 64 units
This means you should maintain 64 units of safety stock to achieve a 95% service level (avoiding stockouts 95% of the time).
Adjusting Safety Stock by Product Category
Not all products deserve the same service level. Optimize inventory investment by categorizing products:
- A-items (high value, high velocity): 98-99% service level
- B-items (moderate value/velocity): 95-97% service level
- C-items (low value, low velocity): 90-93% service level
This approach prevents over-investment in slow-moving items while ensuring your bestsellers rarely stock out.
Strategy 2: Optimize Reorder Points with Precision
Your reorder point—when you trigger new purchase orders—is critical for preventing stockouts. Too early and you tie up capital unnecessarily; too late and you risk running out before replenishment arrives.
The Reorder Point Formula
Reorder Point = (Average Daily Sales × Lead Time in Days) + Safety Stock
Using our previous example:
- Average daily sales: 12 units
- Lead time: 14 days
- Safety stock: 64 units
Reorder Point = (12 × 14) + 64 = 232 units
When inventory reaches 232 units, trigger a new purchase order.
Dynamic Reorder Points
Static reorder points work reasonably well for stable products, but most e-commerce inventory faces variability. Dynamic reorder points adjust based on:
- Seasonal demand changes: Increase reorder points before peak seasons
- Promotional activity: Raise reorder points when planning marketing campaigns
- Demand trend shifts: Adjust as products enter growth or decline phases
- Supply chain reliability changes: Increase safety buffers when supplier performance declines
The AI Advantage in Reorder Point Optimization
Manual reorder point calculations work for a handful of SKUs, but become impractical at scale. AI-powered systems like StockPerfect automatically:
- Calculate optimal reorder points for every SKU daily
- Adjust dynamically based on changing conditions
- Account for dozens of variables simultaneously
- Alert you when reorder points are reached
- Generate suggested purchase orders automatically
A StockPerfect user managing 800+ SKUs noted: "Before AI, I calculated reorder points quarterly for our top 50 products. Now every product gets optimized daily. Our stockout rate dropped 68%."
Strategy 3: Implement Robust Demand Forecasting
Accurate demand forecasting is the foundation of stockout prevention. If you can't predict what customers will buy, you can't stock appropriately.
Multi-Method Forecasting Approach
Don't rely on a single forecasting method. Combine multiple approaches for better accuracy:
1. Time Series Analysis
Analyze historical sales patterns to project future demand. Methods include:
- Moving averages: Simple but effective for stable products
- Exponential smoothing: Gives more weight to recent data
- ARIMA models: Advanced statistical forecasting for complex patterns
2. Seasonality Indexing
Calculate seasonal indices for each period (month, week, even day of week) and apply them to baseline forecasts. For example, if December typically sees 180% of average monthly sales, multiply your baseline forecast by 1.8.
3. Causal Forecasting
Identify factors that influence demand and incorporate them into predictions:
- Marketing campaign schedules and expected ROI
- Pricing changes and elasticity estimates
- Competitive landscape shifts
- Economic indicators relevant to your market
4. Judgmental Forecasting
Don't discount human insight. Experienced merchants often possess knowledge that data doesn't capture—upcoming industry trends, supplier issues, or market shifts. Combine data-driven forecasts with informed judgment.
Forecasting Accuracy Measurement
You can't improve what you don't measure. Track forecasting accuracy using these metrics:
Mean Absolute Percentage Error (MAPE):
MAPE = (1/n) × Σ|(Actual - Forecast)/Actual| × 100
A MAPE under 10% is excellent, 10-20% is good, 20-50% is acceptable for many businesses, and above 50% indicates forecasting methods need improvement.
Forecast Bias: Measures whether forecasts consistently over-predict or under-predict. Calculated as average (Forecast - Actual). A positive bias means consistent over-forecasting; negative means under-forecasting. Target a bias close to zero.
Strategy 4: Diversify and Strengthen Supplier Relationships
Even perfect demand forecasting can't prevent stockouts if your supplier can't deliver. Supply chain resilience requires strategic supplier management.
The Multi-Sourcing Strategy
Relying on a single supplier creates vulnerability. Consider these multi-sourcing approaches:
Primary-Secondary Model
Maintain a primary supplier for 70-80% of volume and a secondary supplier for 20-30%. Benefits:
- Leverage with primary supplier through volume
- Backup option if primary supplier faces issues
- Competitive pressure to maintain quality and pricing
Regional Diversification
Source from suppliers in different geographic regions to mitigate regional disruptions (natural disasters, political instability, port congestion).
Capability-Based Diversification
Use different suppliers for different needs:
- High-volume, cost-focused supplier for steady-state inventory
- Premium, fast-turnaround supplier for emergency replenishment
- Local supplier for quick response, international for cost efficiency
Supplier Performance Scorecards
Track supplier performance systematically with scorecards measuring:
- On-time delivery rate: Percentage of orders delivered by promised date
- Lead time consistency: Standard deviation of actual vs. promised lead times
- Order accuracy: Percentage of orders with correct items and quantities
- Quality defect rate: Percentage of defective items received
- Communication responsiveness: Average time to respond to inquiries
- Flexibility: Willingness to accommodate rush orders or quantity changes
Review scorecards quarterly and address declining performance proactively. Excellent suppliers deserve loyalty and potentially larger volume allocations; underperformers should face consequences or replacement.
Building Supplier Partnerships
Transform supplier relationships from transactional to strategic:
- Share forecasts: Give suppliers visibility into your expected demand 3-6 months out
- Collaborative planning: Work together on capacity planning and inventory positioning
- Information sharing: Alert suppliers to promotional plans that will spike demand
- Long-term commitments: Consider annual volume commitments in exchange for better pricing and priority treatment
- Problem-solving mindset: When issues arise, work together to find solutions rather than assigning blame
Strategy 5: Leverage Predictive Analytics
Modern predictive analytics goes beyond traditional forecasting, using machine learning to identify patterns and relationships that humans would miss.
What Predictive Analytics Can Detect
Leading Indicators
Identify metrics that predict future stockouts before they happen:
- Website traffic increases to specific product pages
- Shopping cart additions trending above normal
- Search query volume for product keywords
- Social media mention velocity
- Competitor pricing changes triggering demand shifts
Product Affinity Patterns
When Product A stocks out, demand for Product B may increase as customers seek alternatives. Predictive analytics identifies these relationships, allowing proactive inventory adjustments.
Cannibalization Dynamics
New product launches often cannibalize existing product sales. Predictive models estimate this impact, preventing overstock situations on affected items.
External Event Correlation
Advanced analytics can correlate sales patterns with external events:
- Weather patterns (selling more rain gear before forecasted storms)
- Sports events (team merchandise sales around games)
- Cultural moments (products trending on social media)
- Economic data releases (luxury goods sales correlating with consumer confidence)
Implementing Predictive Analytics
For most Shopify merchants, building custom predictive models isn't practical. Instead, leverage tools that provide predictive capabilities:
- AI-powered inventory platforms: Solutions like StockPerfect.ai embed predictive analytics into daily operations
- Google Analytics + BigQuery: Export GA data to BigQuery for custom analysis
- Shopify app ecosystem: Various apps provide demand prediction features
Strategy 6: Master Seasonal Planning
Seasonal demand fluctuations are a leading cause of stockouts. Products sell at 3-5x normal rates during peak seasons, overwhelming standard inventory management approaches.
The Seasonal Planning Framework
Phase 1: Historical Analysis (12-16 weeks before peak)
- Analyze past 2-3 years of seasonal performance
- Identify best-selling items during peak period
- Calculate seasonal index for each product (peak sales / average sales)
- Note any stockouts or inventory issues from previous years
Phase 2: Demand Projection (10-12 weeks before peak)
- Apply seasonal indices to current baseline sales
- Adjust for business growth (if sales are up 20% YoY, increase seasonal projections accordingly)
- Factor in planned marketing activities
- Create conservative, moderate, and aggressive demand scenarios
Phase 3: Inventory Build-Up (8-10 weeks before peak)
- Calculate total inventory needed for peak period
- Account for supplier lead times and order multiple shipments if needed
- Build safety stock to higher levels (increase service level targets)
- Secure warehouse/storage capacity for increased inventory
Phase 4: Monitoring and Adjustment (during peak period)
- Track actual sales vs. projections daily
- Identify items selling faster than expected
- Place emergency orders if needed (having pre-arranged expedited shipping with suppliers)
- Communicate stockout risks to marketing team to adjust promotional focus
Phase 5: Post-Season Analysis (1-2 weeks after peak)
- Compare actual performance to projections
- Document stockouts and their causes
- Identify overstock situations
- Create lessons-learned document for next year's planning
Seasonal Planning Success Story
A Shopify toy store implemented comprehensive seasonal planning for the 2025 holiday season:
- Previous year (ad-hoc planning): 47 stockouts on key items, missed sales estimated at $180,000
- Current year (structured planning): 3 stockouts (all on unexpected viral products), maintained 98.5% stock availability
- Revenue impact: Holiday sales up 34% YoY (vs. 12% overall business growth)
- Owner reflection: "The framework gave us confidence to order aggressively on our top sellers without fear of overstock. We nailed the season."
Strategy 7: Create a Stockout Response Playbook
Despite best efforts, occasional stockouts may occur. Having a response playbook minimizes damage.
Immediate Actions (Day 1)
- Assess timeline: When will replenishment arrive? Can it be expedited?
- Communicate to customers: Update product pages with restock dates
- Enable back-orders: If appropriate, allow customers to pre-order with expected ship date
- Notify interested customers: Email customers who viewed the product or added it to cart
- Adjust marketing: Pause or redirect advertising spend from out-of-stock items
Short-Term Actions (Days 2-3)
- Promote alternatives: Recommend similar products in stock
- Offer incentives: Consider discounts on alternative products or pre-orders
- Source emergency inventory: Can you acquire stock from another supplier, competitor, or distributor?
- Communicate with pending orders: Update customers with realistic timelines
Recovery Actions (Week 1+)
- Root cause analysis: Why did the stockout occur? What can prevent recurrence?
- Customer recovery: Reach out to customers who encountered stockouts with special offers
- Replenishment announcement: Email campaign announcing product is back in stock
- Process improvement: Update forecasting models, reorder points, or supplier agreements
Implementing Your Stockout Prevention System
These strategies work, but only if implemented systematically. Here's how to build your stockout prevention system:
Month 1: Foundation
- Audit current inventory data accuracy
- Implement proper SKU categorization (ABC analysis)
- Calculate safety stock and reorder points for top 20% of products
- Create supplier performance scorecards
Month 2: Optimization
- Extend safety stock/reorder point calculations to all products
- Implement demand forecasting models
- Set up automated reorder alerts
- Begin tracking stockout incidents and forecasting accuracy
Month 3: Automation
- Evaluate and implement inventory management software
- Create automated workflows for reordering
- Build dashboards for key inventory metrics
- Develop seasonal planning calendar
Ongoing: Continuous Improvement
- Monthly review of stockout incidents
- Quarterly forecasting accuracy analysis
- Semi-annual supplier performance reviews
- Annual inventory management process audit
Conclusion: From Reactive to Proactive
Stockout prevention isn't about eliminating all stockouts—achieving 100% availability is neither practical nor economically efficient. Instead, it's about reducing stockouts to manageable levels (typically 95-99% stock availability) through systematic, data-driven approaches.
The strategies in this playbook—from safety stock calculations to supplier diversification to predictive analytics—transform inventory management from reactive firefighting to proactive planning. When implemented together, they create a robust system that protects revenue, preserves customer relationships, and enables confident business growth.
Most importantly, modern technology has made sophisticated stockout prevention accessible to businesses of all sizes. What once required expensive enterprise software and dedicated analysts can now be achieved through AI-powered platforms designed specifically for e-commerce.
The choice is clear: continue losing sales and customers to preventable stockouts, or implement the systematic approaches outlined in this playbook. The tools exist, the frameworks are proven, and the ROI is compelling. The only question is how soon you'll start.
Ready to implement AI-powered stockout prevention for your Shopify store? Discover StockPerfect.ai and join thousands of merchants who've virtually eliminated stockouts while optimizing inventory investment.